CH. Résia Letter — 2026-06-08
CH. Résia Letter
Premium Daily Market Intelligence — June 08, 2026
Institutional-style macro and cross-asset briefing generated from the Bayesian market stack.

1. Executive summary
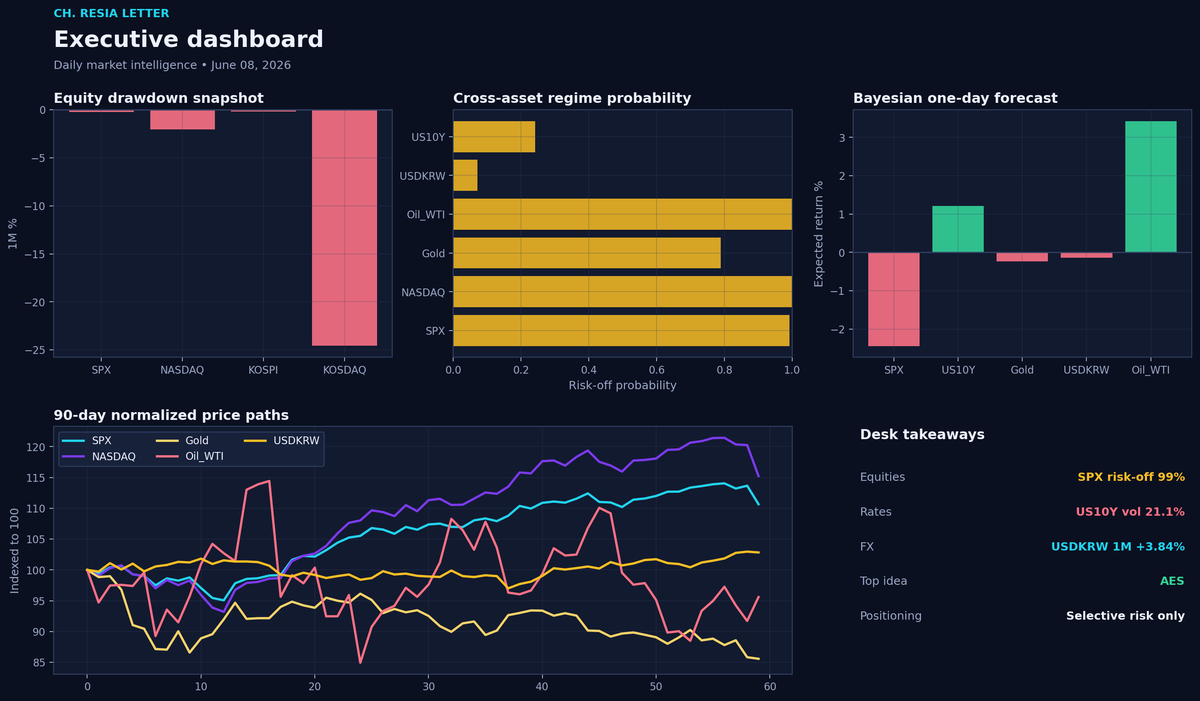
What matters today
- Global equities remain under pressure: S&P 500 is down -0.21% over one month with a 99% risk-off posterior.
- Growth leadership is still absent: Nasdaq daily move was -4.18% and model volatility is 32.1% annualized.
- USD/KRW strengthened to 1,531.14, up +3.84% on the month, reinforcing a tighter external backdrop for Korean risk assets.
- Rates are still the macro stress point: the U.S. 10-year yield sits at 4.54% with High vol conditions.
- Near-term Bayesian forecast stays defensive: SPX ▼, US10Y ▲, Gold ▼, USD/KRW ▼, Oil ▲.
- Single-name opportunity remains selective rather than broad: top-ranked long is AES with score 0.780 and 61.9% 20-day upside probability.
House view
The macro tape still favors selective exposure over broad beta. Risk-off probabilities remain elevated across equities and rates, while FX pressure and high rates volatility keep the overall regime restrictive.
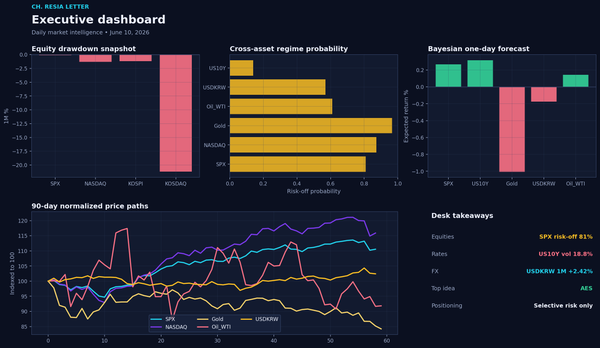
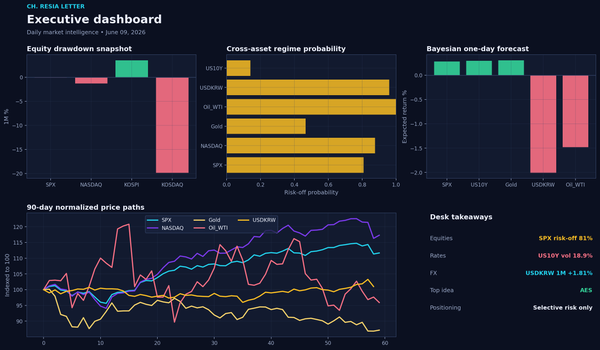
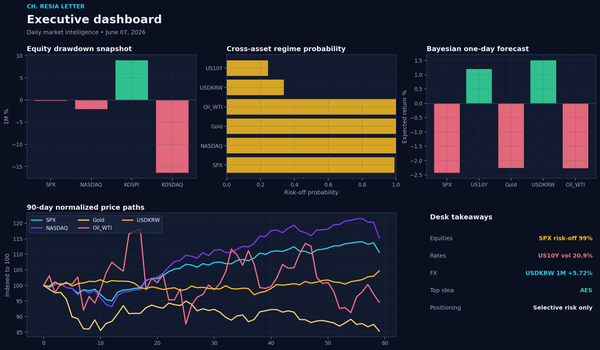
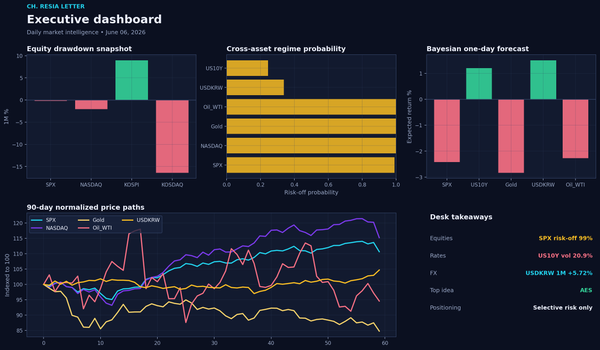
2. Visual dashboard
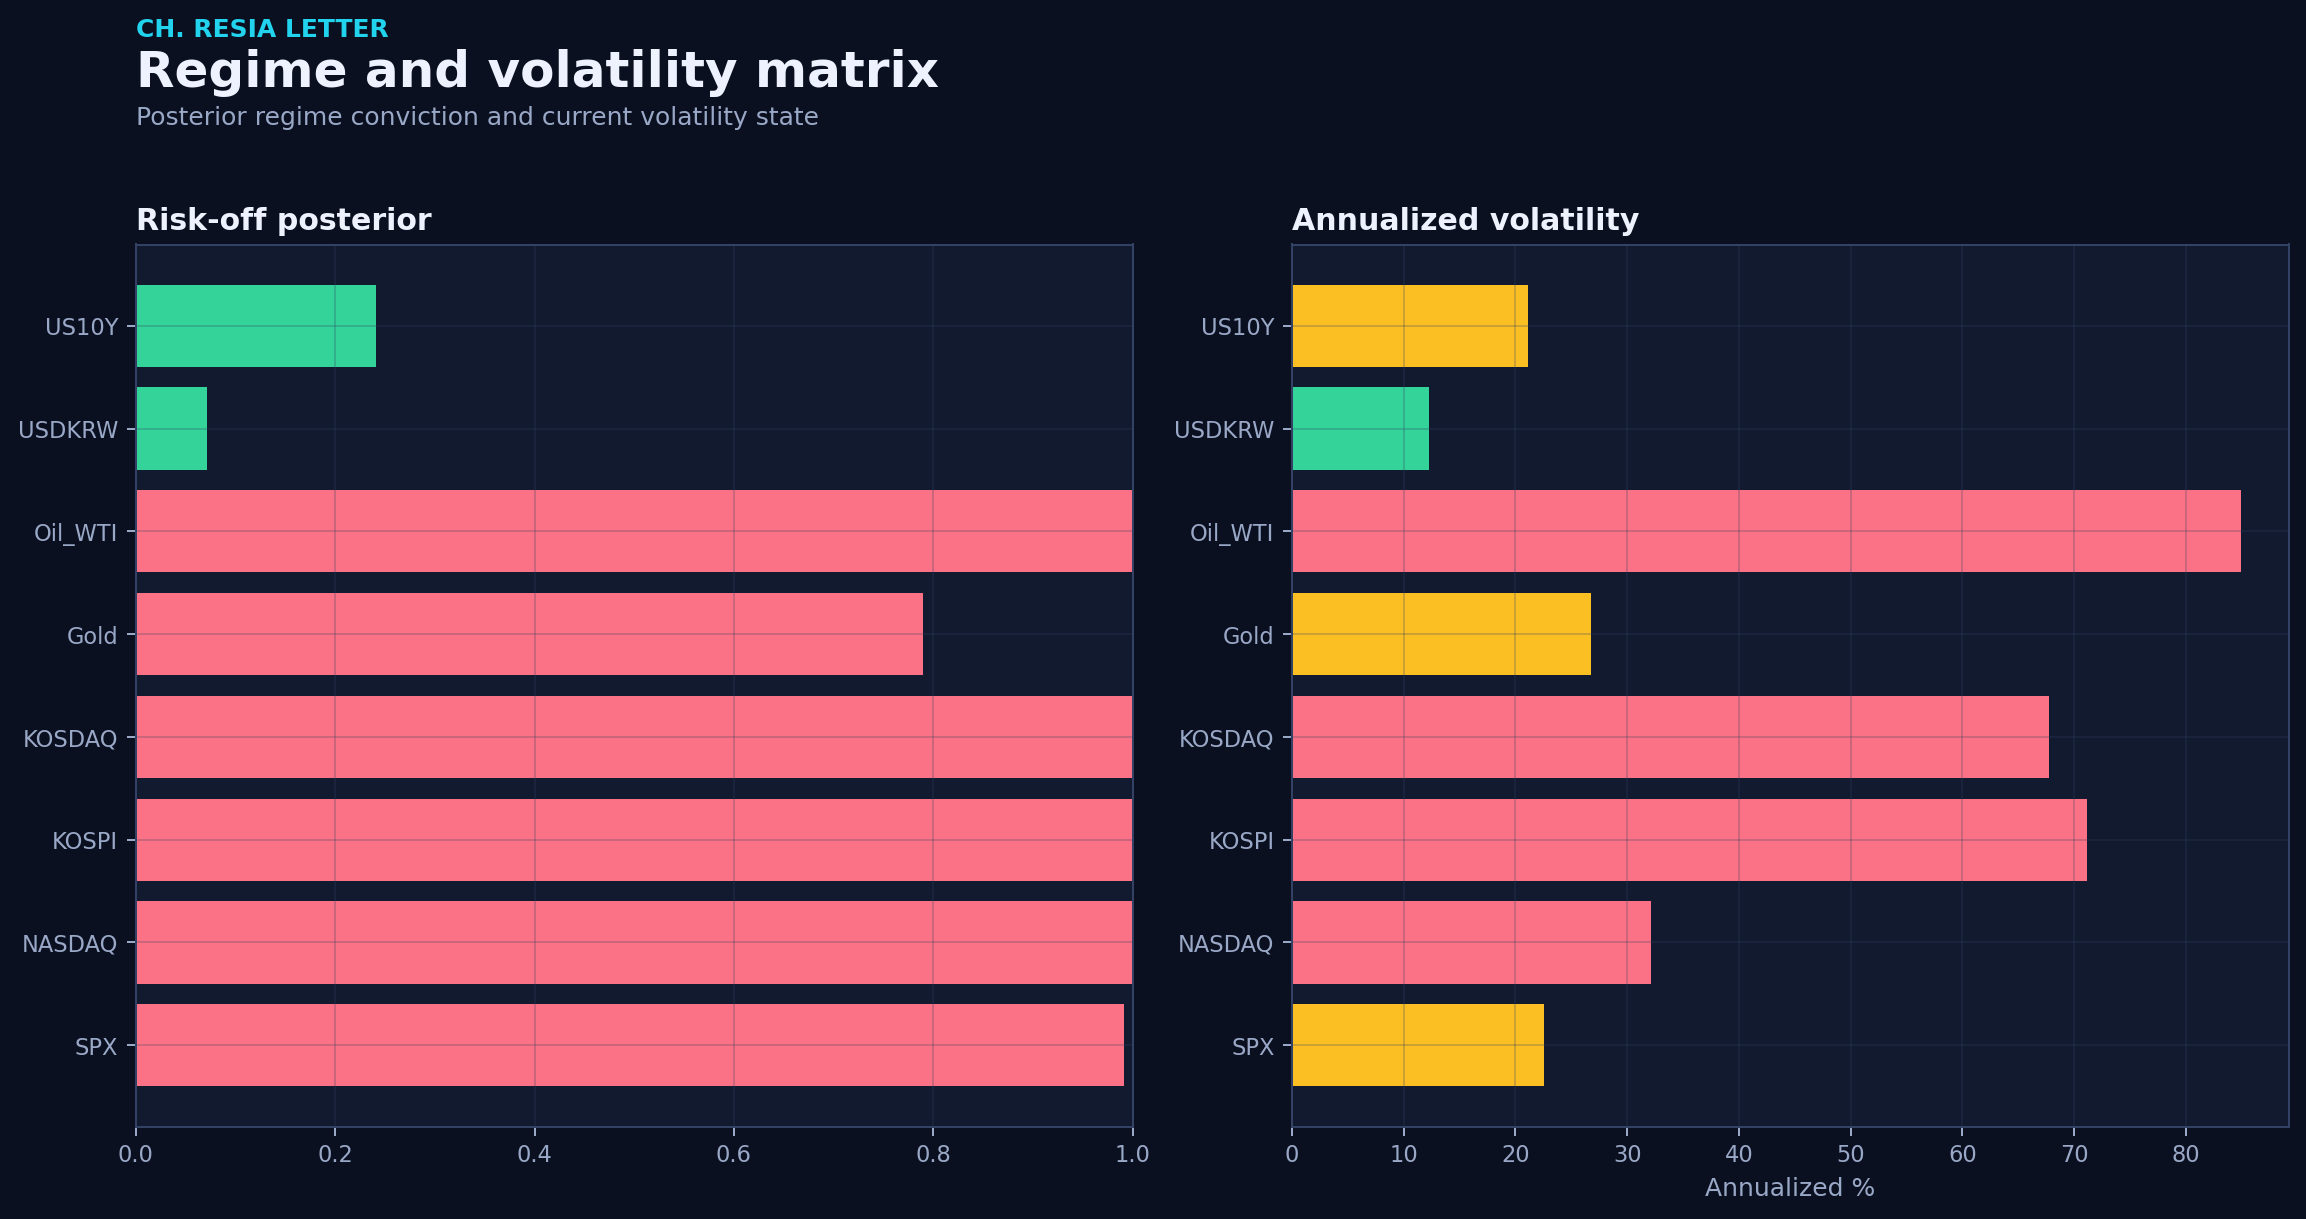
The matrix above is the fastest read on the system: posterior regime conviction is still skewed toward defense, while current volatility remains too elevated to support a clean risk-on chase.
3. Cross-asset scoreboard
| Asset | Last | 1D | 1W | 1M | Regime | Volatility |
|---|---|---|---|---|---|---|
| SPX | 7,383.74 | -2.64% | -2.85% | -0.21% | Risk-Off | High vol |
| NASDAQ | 25,709.43 | -4.18% | -5.09% | -2.05% | Risk-Off | High vol |
| KOSPI | 7,484.41 | -8.29% | -14.84% | -0.18% | Risk-Off | High vol |
| KOSDAQ | 911.39 | -9.08% | -13.20% | -24.54% | Risk-Off | High vol |
| US10Y | 4.54 | +1.32% | +1.36% | +3.94% | Risk-On | High vol |
| USDKRW | 1,531.14 | -0.13% | +1.31% | +3.84% | Risk-On | Low vol |
| Gold | 4,324.30 | -0.30% | -3.67% | -8.36% | Risk-Off | Low vol |
| Oil_WTI | 94.37 | +4.23% | +0.65% | -3.77% | Risk-Off | Moderate vol |
SPX is lower on the day, Nasdaq is lower, and USD/KRW remains in a calm but still fragile transition state.
4. Bayesian regime & forecast read
One-day directional bias
| Variable | Direction | Forecast return | Uncertainty | Persistence |
|---|---|---|---|---|
| SPX | ▼ | -2.44% | 1.26% | 0.900 |
| US10Y | ▲ | 1.21% | 1.57% | 0.896 |
| Gold | ▼ | -0.23% | 2.47% | 0.892 |
| USDKRW | ▼ | -0.13% | 1.11% | 0.898 |
| Oil_WTI | ▲ | 3.43% | 7.13% | 0.828 |
Dominant cross-effects
- Oil_WTI → US10Y: coefficient 0.0093
- Oil_WTI → SPX: coefficient -0.0083
- Oil_WTI → Gold: coefficient 0.0081
5. Equity selection
The stock scanner processed 553 names. Opportunity remains concentrated in a narrow group of resilient names rather than across the market.
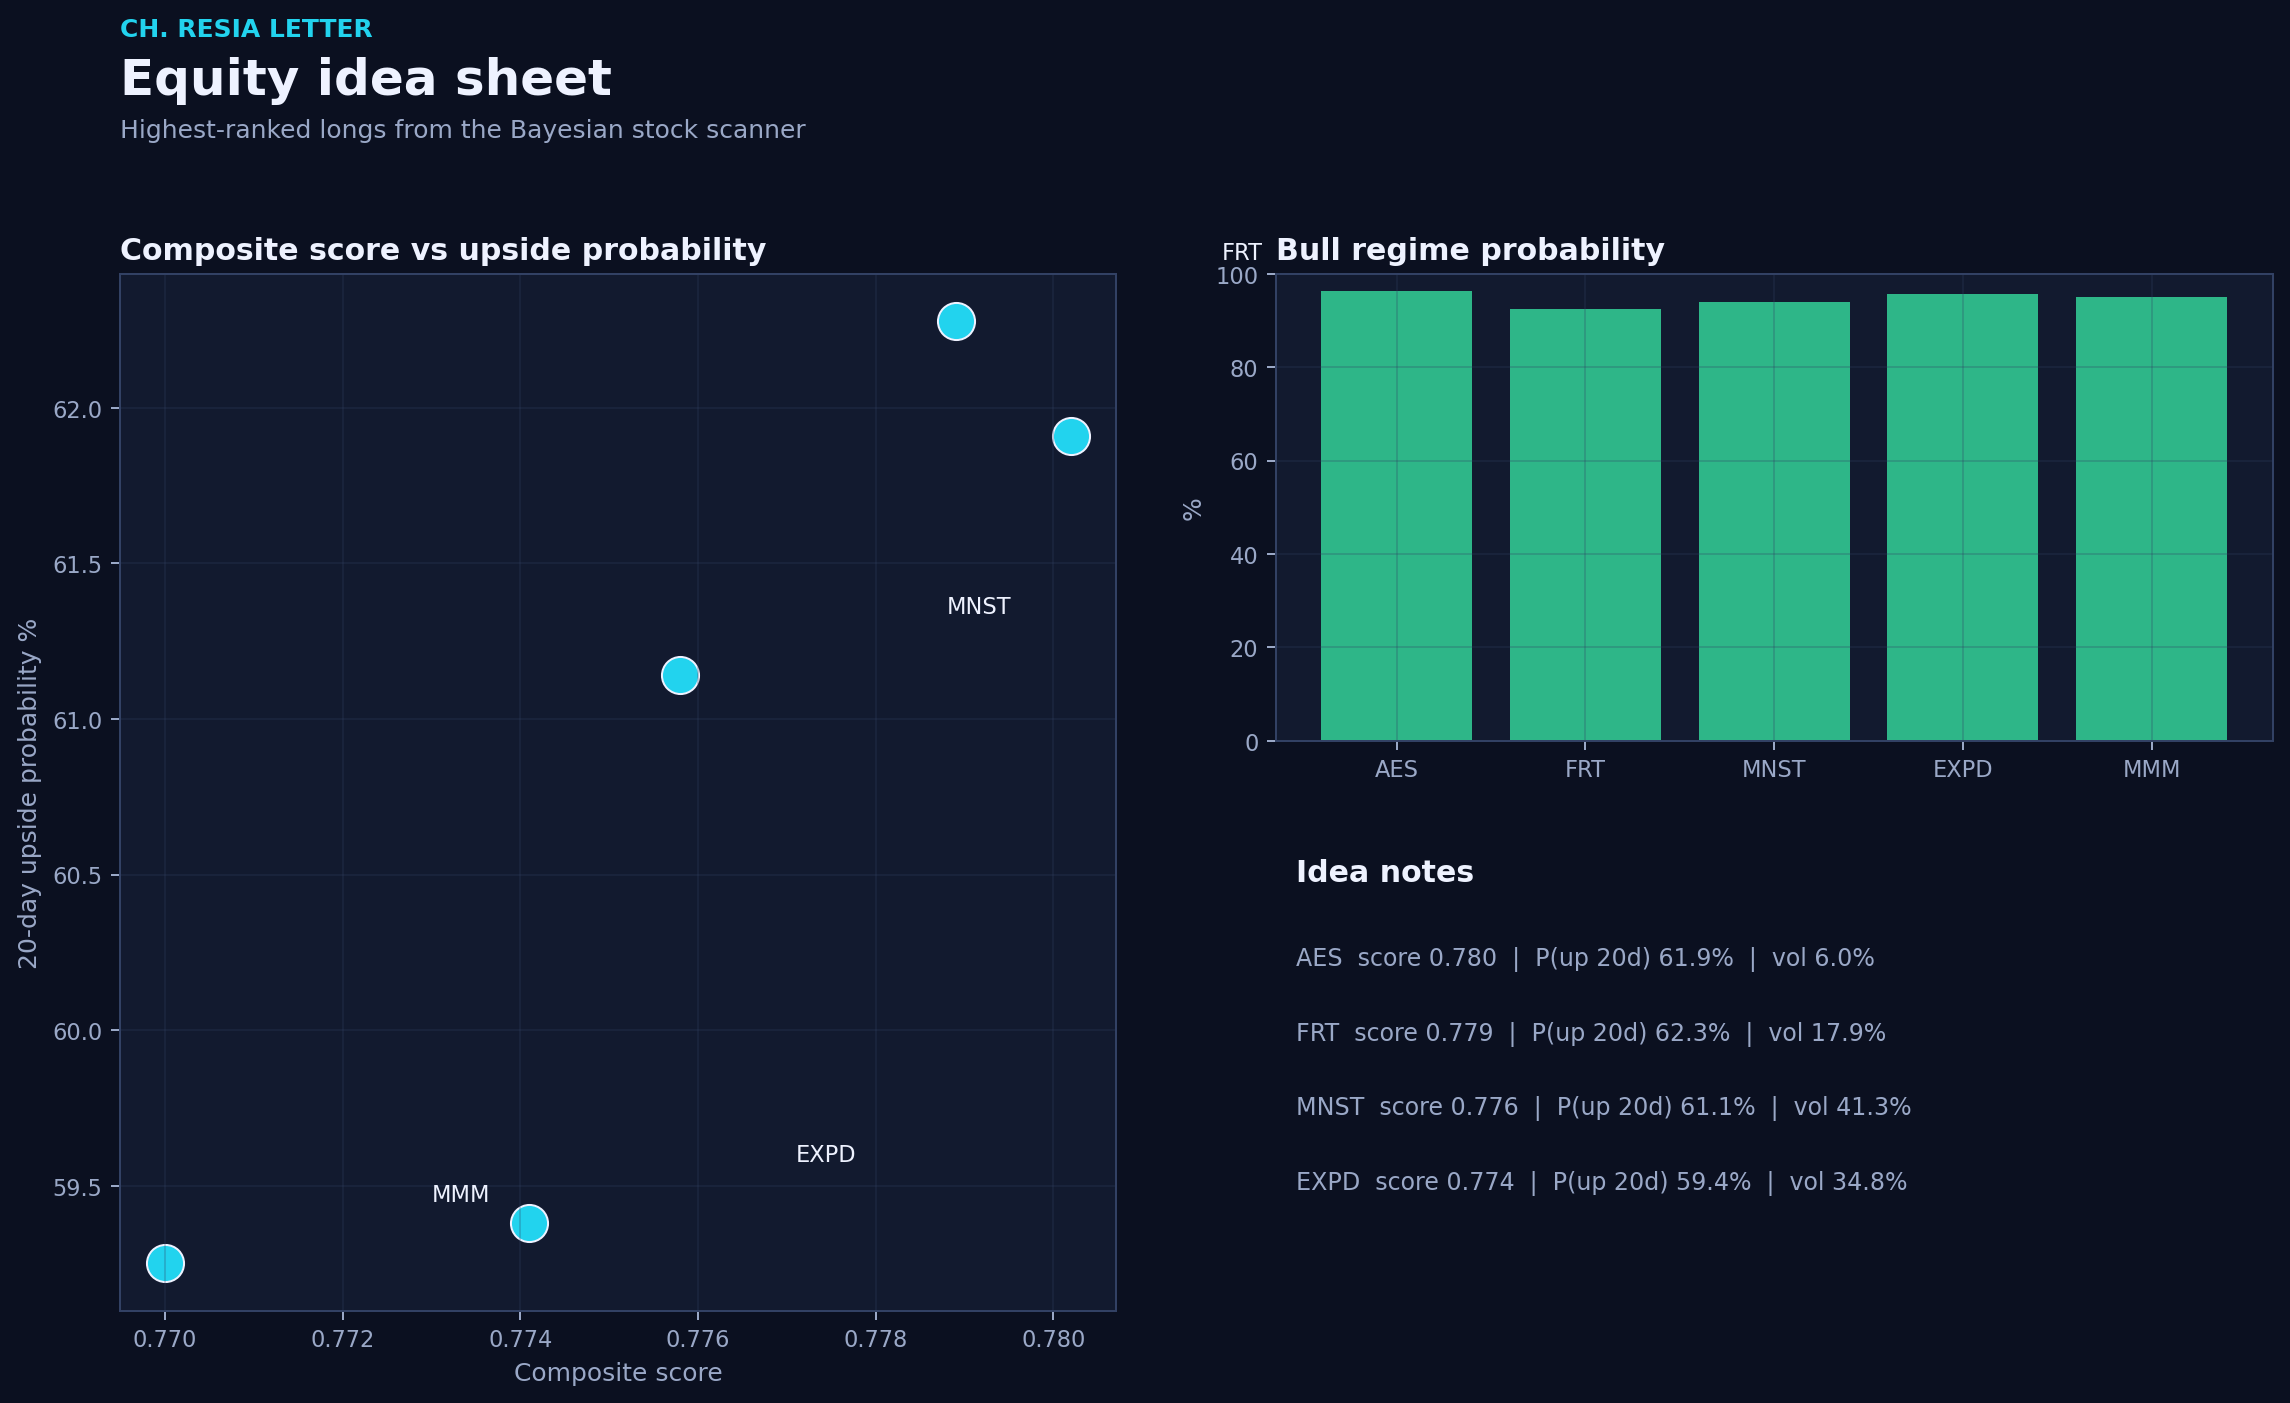
Top-ranked longs
| Ticker | Price | Score | P(up 20d) | Bull regime | Ann. vol | 1M |
|---|---|---|---|---|---|---|
| AES | 14.67 | 0.780 | 61.9% | 96.3% | 6.0% | +2.37% |
| FRT | 122.56 | 0.779 | 62.3% | 92.5% | 17.9% | +5.95% |
| MNST | 89.55 | 0.776 | 61.1% | 93.9% | 41.3% | +3.78% |
| EXPD | 160.44 | 0.774 | 59.4% | 95.8% | 34.8% | +2.39% |
| MMM | 153.76 | 0.770 | 59.2% | 95.0% | 24.1% | +7.31% |
Lowest-ranked names
- AMZN (AMZN): score 0.341, 20-day upside probability 38.8%, monthly move -9.77%.
- TSN (TSN): score 0.339, 20-day upside probability 35.7%, monthly move -14.11%.
- 003670.KS (Posco Future M): score 0.321, 20-day upside probability 29.4%, monthly move -35.28%.
6. Macro monitor
United States
| Series | Latest | Change | Trend | Date |
|---|---|---|---|---|
| CPI | 332.41 | +0.64% | 상승 추세 | 2026-04-01 |
| Unemployment | 4.30 | 0.00% | 혼조세 | 2026-05-01 |
| US10Y | 4.47 | -0.45% | 혼조세 | 2026-06-04 |
| US2Y | 4.05 | -0.74% | 혼조세 | 2026-06-04 |
| VIX | 15.40 | -4.11% | 혼조세 | 2026-06-04 |
| DXY | 118.88 | -0.13% | 혼조세 | 2026-05-29 |
| Initial_Claims | 225,000.00 | +6.13% | 혼조세 | 2026-05-30 |
| Retail_Sales | 757,085.00 | +0.49% | 혼조세 | 2026-04-01 |
Korea
| Series | Latest | Change | Date |
|---|---|---|---|
| 기준금리 | 2.50 | 0.00% | 202605 |
| 소비자물가지수 | 119.92 | +0.46% | 202605 |
| 경상수지 | 28,292.30 | -25.41% | 202604 |
7. Digital assets
Bitcoin trades at 63,223.00, Ethereum at 1,671.10, and the sentiment gauge reads 8 (Extreme Fear). That keeps crypto tactical rather than strategic.
8. Bottom line
This is still a preservation-first tape. The sellable setup is not broad bullishness but disciplined selection: keep duration of conviction short, prefer names with strong posterior upside and contained volatility, and treat macro rallies as tactical until rates and FX stress materially cool.
Methodology: Bayesian regime switching, stochastic volatility filters, Bayesian VAR, and a cross-sectional stock-scoring model.
Data sources: FRED, ECOS, Yahoo Finance, CoinGecko, and internal processed datasets.
This report is generated from model outputs and formatted into a research product. It is not investment advice.